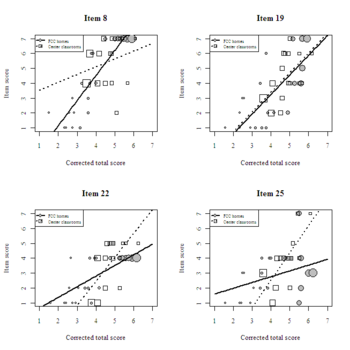
The Early Childhood Environment Rating Scale (Revised; ECERS-R) was designed to measure process quality in child care centers, but the data set that I have been analyzing contains ratings of center classrooms and family child care (FCC) homes. A sizable portion of the program’s budget was spent on training ECERS-R raters. Training them to reliably use both the ECERS-R and the Family Day Care Rating Scale (FDCRS) was cost prohibitive.
Was it unfair to rate FCC homes with the ECERS-R instrument? I conducted a differential item functioning (DIF) analysis to answer that question and remedy any apparent biases. Borrowing a quasi-experimental matching technique (not for the purpose of inferring causality), I employed propensity score weighting to match center classrooms with FCC homes of similar quality. For each item j, classroom/home i‘s propensity score (i.e., predicted probability of being an FCC home) was estimated using the following logistic regression model:
,
where FCC is a focal group dummy variable (1 if home; 0 if center) and Totalc stands for corrected total score (i.e., mean of item scores excluding item j). Classroom weights were calculated from the inverse of a site’s predicted probability of its actual type and normalized so the weights sum to the original sample size:
.
Such weights can induce overlapping distributions (i.e., balanced groups). In this case, the weights were were applied via weighted least squares (WLS) regression of item scores on corrected total scores and the focal group dummy, as well as an interaction term to consider the possibility of nonuniform/crossing DIF:
.
By minimizing , WLS gave classrooms/homes with weights greater than 1 more influence over parameter estimates and decreased the influence of those with weights less than 1.
The results suggest that three provisions for learning items function differentially and in a non-uniform manner, as indicated by statistically significant interactions (see the table below). None of the language/interaction items exhibited DIF. The regression coefficients suggest that differentially functioning ECERS items did not consistently favor one type of care over the other. After dropping the three differentially functioning items from the provisions for learning scale and re-running the DIF analysis, none of the remaining items exhibited differential functioning.
Summary of WLS estimates: Differentially functioning ECERS items
Estimate Std. Error t value Pr(> |t|)
Item 8: Gross motor equipment
Intercept 3.014 2.044 1.475 0.149
Corrected total 0.523 0.445 1.175 0.248
FCC home -5.234 2.278 -2.297 0.028
Corrected*FCC 1.161 0.498 2.332 0.026
Item 22: Blocks
Intercept -3.990 1.919 -2.079 0.045
Corrected total 1.608 0.403 3.994 0.000
FCC home 3.929 2.076 1.892 0.067
Corrected*FCC -0.893 0.437 -2.045 0.049
Item 25: Nature/science
Intercept -4.802 2.566 -1.872 0.070
Corrected total 1.833 0.540 3.393 0.002
FCC home 5.996 2.771 2.164 0.038
Corrected*FCC -1.443 0.584 -2.471 0.019
Plot of weighted observations and fitted lines: Three crossing DIF items and one fair item (Item 19: Fine motor activities)

Scores from the final provisions for learning scale exhibited good reliability of α = 0.87. Scores from the language/interaction scale also exhibited good reliability of α = 0.86. None of the items detracted problematically from overall reliability (i.e., the most that α increased after dropping any item was 0.01 in one instance).
I want to caution readers against generalizing the factor structure and DIF findings beyond this study because the sample is small in size (n = 38 classrooms/homes) and was drawn from a specific population (urban child care businesses subject to local market conditions and state-specific regulations). I largely avoided making statistical inferences in the preceding analyses by exploring the data and comparing relative fit, but in this case I used a significance level of 0.05 to infer DIF. The data do not provide a large amount of statistical power, so there could be more items that truly function differentially. For the final paper, I may apply a standardized effect size criterion. Standardized effect sizes are used to identify DIF with very large samples because the p-values would lead one to infer DIF for almost every item. De-emphasizing p-values in favor of effect sizes may be appropriate with small samples, too.
