
Is student proficiency in a school district related to proficiency levels in neighboring districts? I’m continuing my foray into spatial methods by analyzing spatial dependency among standardized test scores at the school district level in Minnesota. If the influence of neighboring school districts is significant, then district performance could be evaluated in a manner that controls for the influence of neighbors (e.g., with a spatial lag model expressed as y = ρWy + Xβ + ε). Additionally, we could single out school districts that exceed expectations, where expected performance is predicted by neighbors.
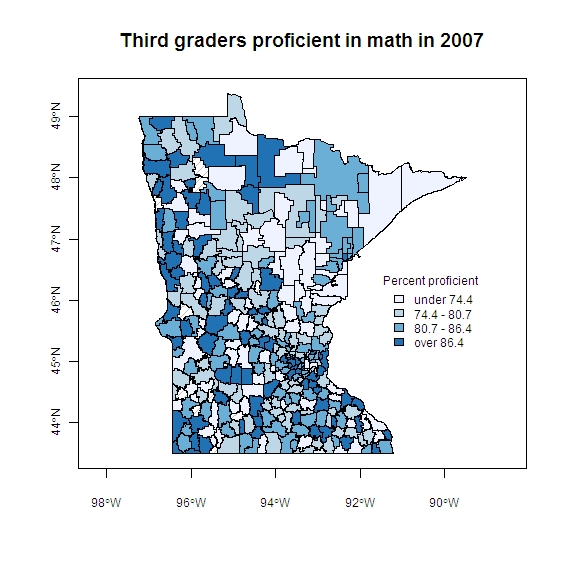
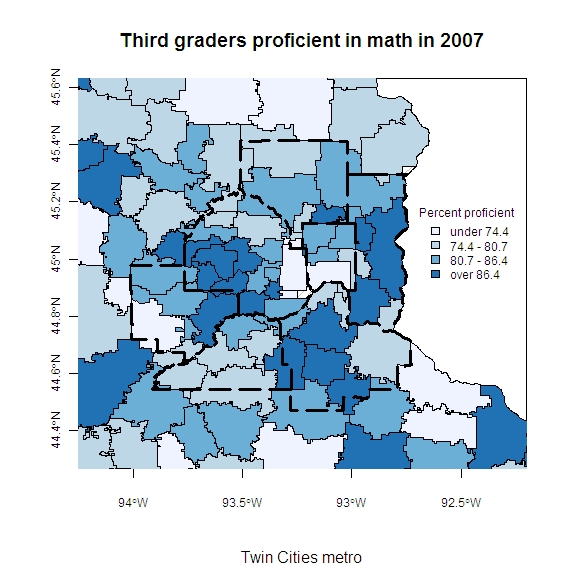
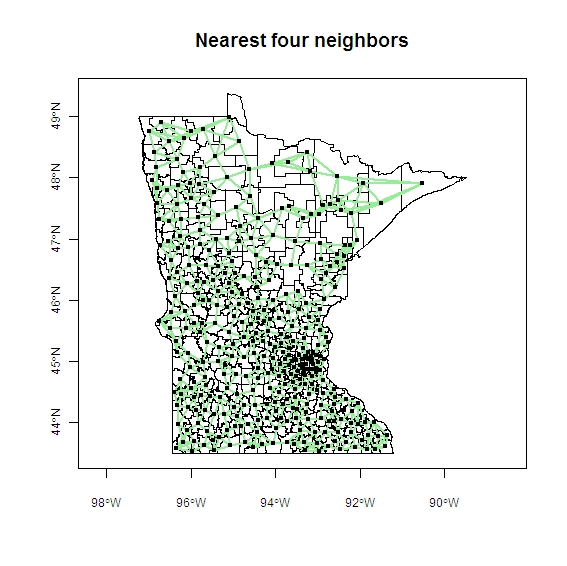
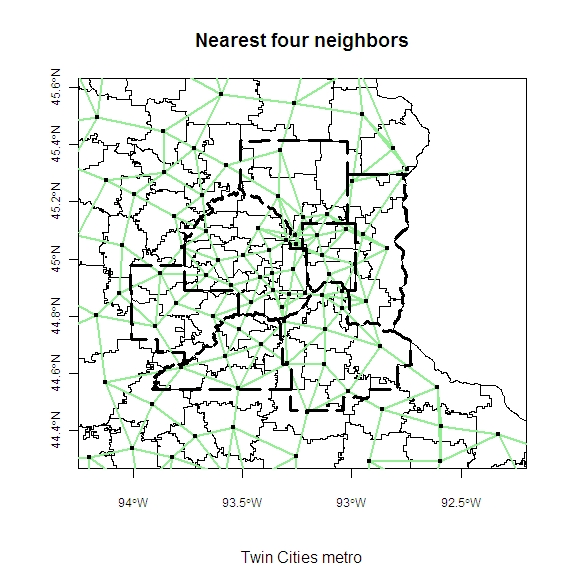
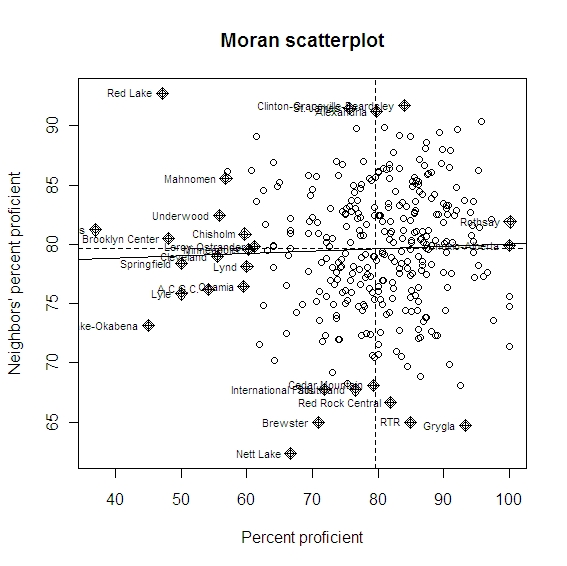
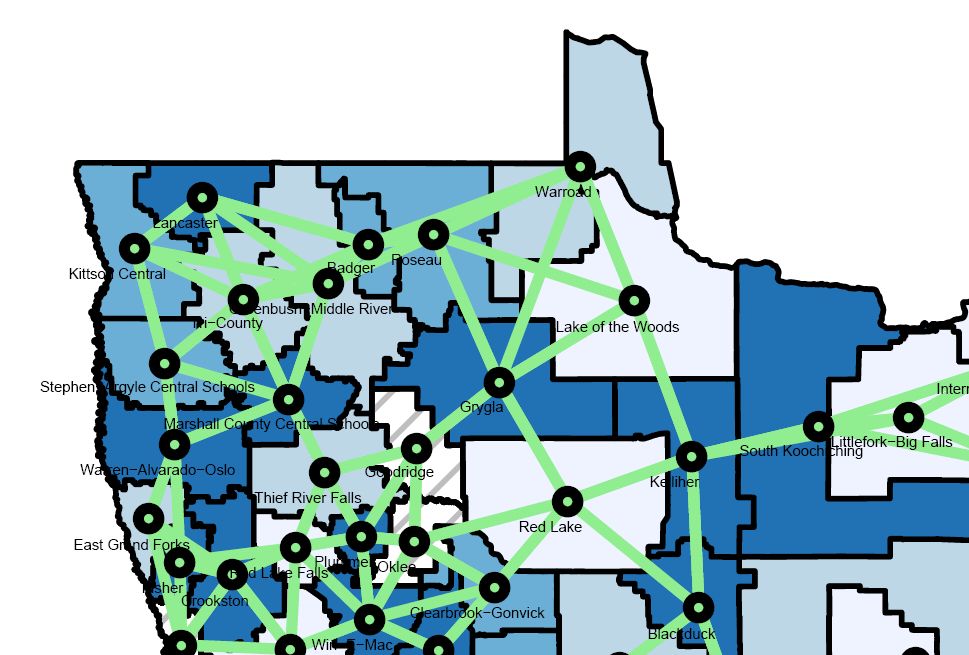
The following maps show third grade math proficiency in 2007 and each district’s four nearest neighbors. As shown in the spatial correlogram, the percentage of students in Grygla Public Schools exhibiting proficiency is greater than the percentage in neighboring districts. The same is true for other districts in or near the bottom right quadrant. Districts in or near the top left quadrant, such as Brooklyn Center and Red Lake, are not faring as well as their neighbors. Note that Grygla and Red Lake are neighbors, their proficiency levels differ greatly, and they border districts with missing test score data (i.e., their spatial lags are weighted by three instead of four neighbors), all of which help explain why they are positioned as outliers in the correlogram.
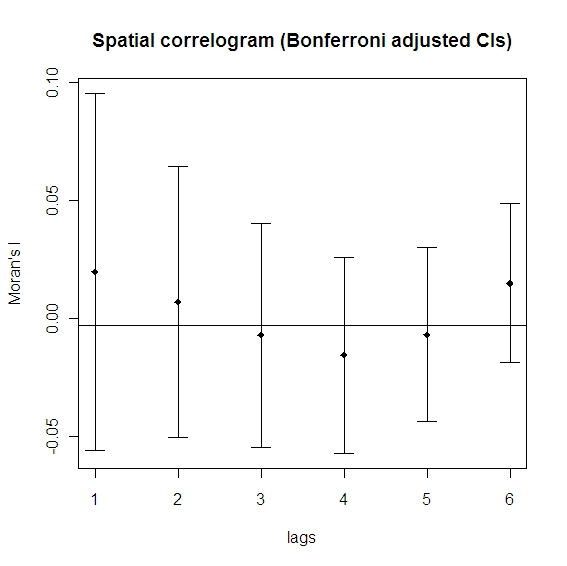
Overall, there’s a lack of evidence that this particular district outcome (percent of third graders proficient in math) is influenced by neighboring districts or nearby districts (out to six lags). The spatial correlation coefficient, Moran’s I, is not significantly different from zero. Future analyses will investigate spatial dependency of other indicators of student and district achievement, such as reading proficiency, proficiency gaps (economic and racial/ethnic), and proficiency by grade level.
Grygla and Red Lake juxtaposed
Moran’s I test
Moran I statistic standard deviate = 0.6023,
p-value = 0.547
alternative hypothesis: two.sided
sample estimates:
Moran I statistic 0.019742685
Expectation -0.003058104
Variance 0.001433003