
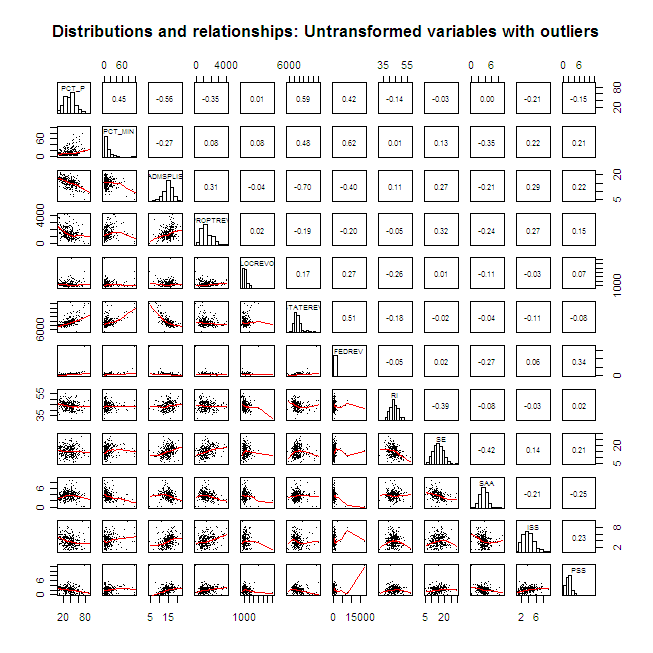
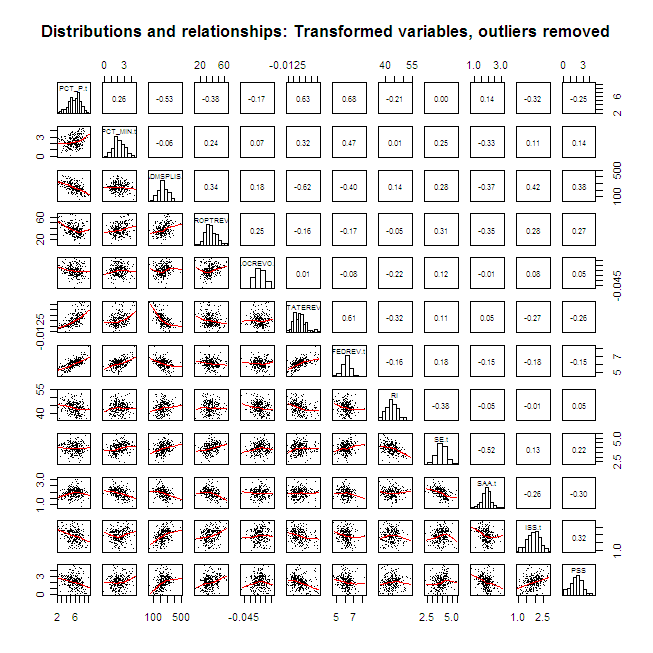
What factors influence a school district’s ability to improve student achievement? With that as my guiding research question, I decided to explore whether demographic and financial variables represent latent factors. If not, then each may influence achievement individually. Using school district information published the Minnesota Department of Education, I explored the latent factor structure of 12 theoretically important predictors of school district success. Before conducting the EFA, I transformed variables with skewed distributions and removed multivariate outliers exhibiting high Mahalanobis distance.
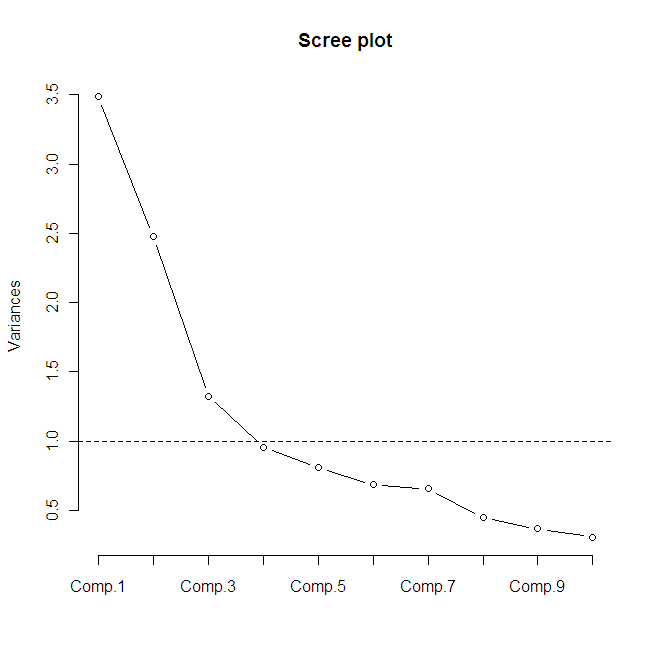
Results from the factor analysis suggest that the predictors load on three latent factors that explain about 51 percent of total variation in the predictors.
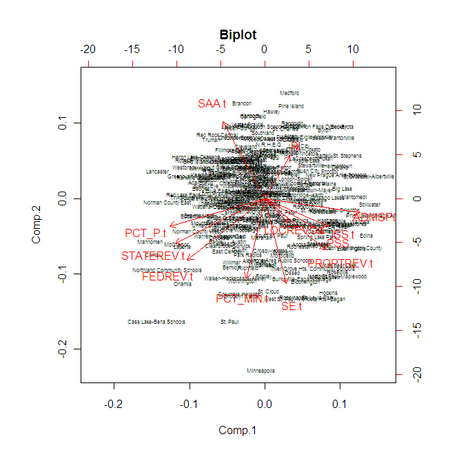
1. Social stratification manifests in higher economic and racial/ethnic segregation and in higher state and federal funding, including appropriations for economically disadvantaged students.
2. Educational enhancement is reflected by higher spending on special education, instructional support services, and pupil support services; lower spending on student activities and athletics; and higher property tax revenue.
3. Regular instruction is apparent in higher spending for regular instruction and in local revenue from sources other than property taxes, although the latter is weakly related. Unclassified local revenue could be removed, reducing it and regular instruction to single, observed variables.
Next steps will include conducting a confirmatory factor analysis with a different year of data and developing a spatio-temporal model of student achievement at the district level.
Data sources
Minnesota Department of Education. (2007a). 2007 Minnnesota Comprehensive Assessment results: Public schools. Saint Paul, MN: Author. Retrieved from: http://education.state.mn.us/MDE/Data/Data_Downloads/Accountability_Data/Assessment_MCA_II/index.html
Minnesota Department of Education. (2007b). School district financial profiles. Saint Paul, MN: Author. Retrieved from: http://education.state.mn.us/MDE/Accountability_Programs/Program_Finance/Financial_Management/School_District_Financial_Profiles/index.html
Minnesota school district demographics, revenues, and expenditures in 2007
| Number of districts | Mean | Standard deviation | Minimum- maximum |
|
|---|---|---|---|---|
| Demographics | ||||
| Percent third graders eligible for free or reduced lunch | 333 | 37.8 | 16.2 | 5.0-100.0 |
| Percent third graders of color and/or Hispanic or Latino ethnicity | 289 | 14 | 16.4 | 0.0-100.0 |
| Average daily membership (ADM) served per licensed instructional staff | 334 | 14.8 | 2.5 | 4.9-22.1 |
| Revenue per ADM | ||||
| Local property taxes | 334 | $1,408 | $711 | -$114-$4,053 |
| Other local source | 334 | $1,214 | $660 | $357-$7,154 |
| State sources | 334 | $7,753 | $994 | $5,496-$12,662 |
| Federal sources | 334 | $663 | $1,123 | $108-$17,358 |
| Percent of revenue expended | ||||
| Regular instruction | 334 | 43.8 | 3.8 | 31.7-66.5 |
| Special education | 334 | 14.9 | 4 | 3.1-29.2 |
| Student activities and athletics | 334 | 3.7 | 1.4 | 0.0-9.8 |
| Instructional support services | 334 | 3.7 | 1.5 | 0.9-9.6 |
| Pupil support services | 334 | 2.1 | 1.7 | 0.0-24.6 |
Loadings (promax rotated):
           Factor1 Factor2 Factor3
PCT_P.t     0.744  -0.216  -0.043
PCT_MIN.t   0.583   0.464   0.165
ADMSPLIS.t -0.475   0.555   0.052
PROPTREV.t -0.142   0.513  -0.064
LOCREVO.t  -0.127   0.129  -0.243
STATEREV.t  0.729  -0.141  -0.157
FEDREV.t    0.883   0.136   0.053
RI         -0.046   0.071   0.994
SE.t        0.211   0.623  -0.310
SAA.t      -0.233  -0.792  -0.140
ISS.t      -0.221   0.398  -0.046
PSS        -0.140   0.447   0.039

               Factor1 Factor2 Factor3
SS loadings      2.636   2.267   1.230
Proportion Var   0.220   0.189   0.102
Cumulative Var   0.220   0.409   0.511

Factor correlations:
        Factor1 Factor2 Factor3
Factor1   1.000  -0.178   0.122
Factor2  -0.178   1.000   0.192
Factor3   0.122   0.192   1.000