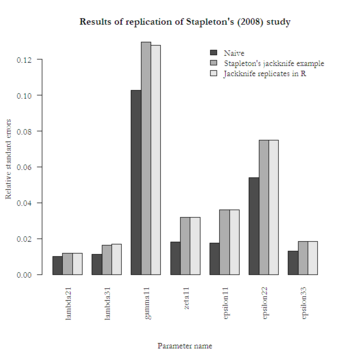
My last post demonstrated a structural equation model (SEM) of complex sample data in ![]() . I attempted to replicate Laura Stapleton’s example, but my standard errors were larger than expected.
. I attempted to replicate Laura Stapleton’s example, but my standard errors were larger than expected.
I wrote to Laura, and she graciously reviewed my results. She attributed the standard error discrepancies to a change in IRT score variances. Specifically, the ECLS-K math and reading scores have been re-scaled since the original data set was published, resulting in larger variances in the currently published version. She supplied me with her version of the original public-use data set.
The updated results with the original data set are nearly identical to her published results. I feel confident now about using ECLS-B jackknife replicate weights for SEM in ![]() , and I learned a lot from attempting the replication.
, and I learned a lot from attempting the replication.
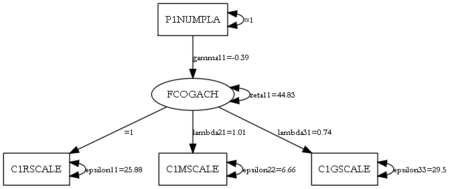
Path diagram of U.S. kindergartners’ cognitive achievement (indicated by reading, math, and general ability scores) regressed on number of residences in last four months