A good friend of mine told me to check out Beer Advocate online. Their rating system does a good job of balancing simplicity (A-F grades) with thoroughness (measures of central tendency and dispersion). I also appreciate the way it encourages raters and readers to consider multiple dimensions of a beer’s quality–its look, smell, taste, and feel–in addition to overall quality.
As a practitioner of multilevel and latent variable modeling, one aspect of Beer Advocate’s rating system has given me pause: a lack of adjustment for consistently high- or low-raters. What’s concerning about a simple average of ratings? Let’s imagine a plausible scenario: a motivated group of beer aficionados with high standards get their hands on a limited-release beer and publish their reviews on Beer Advocate. The beer could be world class, but if only tough raters have tried it, then the average rating will appear lower. Conversely, a large number of uncritical raters could review a mediocre beer, resulting in an excellent rating on average.
Is my concern warranted? If so, which beers and breweries are rated highest after adjusting for raters and other factors? To answer those questions, I wrote some ![]() code to gather Beer Advocate ratings of beers produced by Minnesota breweries. The code relies heavily on the XML and stringr packages. After gathering the ratings, I decided to check my assumption of within-rater consistency. The intraclass correlation coefficient of r = 0.13 indicates a small degree of consistency within raters, but enough to justify my concern.
code to gather Beer Advocate ratings of beers produced by Minnesota breweries. The code relies heavily on the XML and stringr packages. After gathering the ratings, I decided to check my assumption of within-rater consistency. The intraclass correlation coefficient of r = 0.13 indicates a small degree of consistency within raters, but enough to justify my concern.
I specified a multilevel model to obtain value-added ratings of beers and breweries while adjusting for rater and beer characteristics. For simplicity, I decided to focus on the overall rating, although I would like to consider multiple dimensions of beer quality (look, smell, taste, and feel) in future analyses. The model specifies random effects for raters, cross-classified with beers nested in breweries. The fixed effects were the serving type experienced by the rater for a given beer (e.g., can), the beer’s alcohol by volume (ABV), and its style (e.g., porter).
.
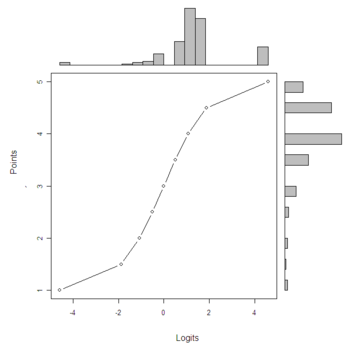
Note that I transformed the overall rating from a 1-5 scale to logits. I did so to avoid predictions below the floor of 1 point and above the ceiling of 5 points on the original scale (i.e., to enforce lower and upper asymptotes) and to spread the ratings out at the tails (e.g., make it “harder” to go from 4.5 to 5 than going from 3.5 to 4). The chart below shows the resulting ogival relationship between the original point system and the logits.
Plot showing transformation from points to logits

I estimated the model parameters with the lme4 package. Given the large number of fixed effects (and the need for future blog content), I’ll describe the influence of serving type, ABV, and style at a later date. The value added by breweries after adjusting for rater and beer characteristics is shown in the table below. Value-added logits were transformed back to the original scale, with values in the table representing point deviations from the brewery average, but the logit and point ratings are virtually the same. August Schell Brewing Company recently won national accolades, but it came in second to a relative newcomer, Fulton Beer. Summit Brewing and Surly Brewing followed closely in the third and fourth spots. The results show some discrepancies between the value-added ratings and Beer Advocate’s grades, which are based on the simple average of all beer ratings. For example, Harriet Brewing received an A-, compared to Schell’s B grade, but Harriet’s value-added rating is below average.
| Brewery | Value-added (logits) | Value-added (points) | Beer Advocate grade (average beer rating) |
|---|---|---|---|
| Fulton Beer | 0.85 | 0.80 | A- |
| August Schell Brewing Co., Inc. | 0.83 | 0.79 | B |
| Summit Brewing Company | 0.80 | 0.76 | B+ |
| Surly Brewing Company | 0.71 | 0.68 | A- |
| Minneapolis Town Hall Brewery | 0.27 | 0.27 | A- |
| Lake Superior Brewing Company | 0.18 | 0.18 | B |
| Fitger’s Brewhouse | 0.10 | 0.10 | B+ |
| Olvalde Farm & Brewing Company | 0.08 | 0.08 | A- |
| Granite City Food & Brewery | 0.04 | 0.04 | B- |
| Flat Earth Brewing Company | 0.03 | 0.03 | B+ |
| Brau Brothers Brewing Co., LLC | 0.02 | 0.02 | B |
| Pig’s Eye Brewing Company | 0.00 | 0.00 | D+ |
| Harriet Brewing | -0.09 | -0.09 | A- |
| Lift Bridge Brewery | -0.11 | -0.11 | B+ |
| Leech Lake Brewing Company | -0.14 | -0.14 | B+ |
| Barley John’s Brew Pub | -0.26 | -0.26 | B+ |
| McCann’s Food & Brew | -0.27 | -0.26 | B+ |
| St. Croix Brewing Company, LLC | -0.69 | -0.66 | C |
| Cold Spring Brewing Co. | -0.99 | -0.91 | D+ |
| Great Waters Brewing | -1.37 | -1.19 | B+ |
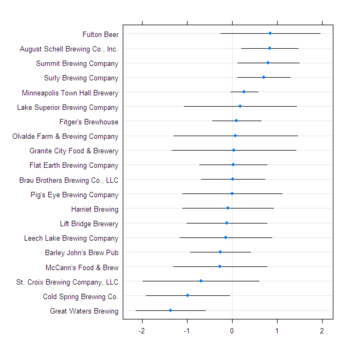
A different picture emerges when one considers that value-added ratings are point estimates within a range of certainty. The prediction-interval plot below shows that we can’t confidently conclude that Fulton Beer scored above average, let alone out performed Shell’s, Summit, or Surly. We can confidently say, though, that Shell’s, Summit, and Surly scored above average, and along with Minneapolis Town Hall Brewery, they significantly out-performed Cold Spring Brewing Co. and Great Waters Brewing.
Plot of breweries’ value-added ratings with 95% prediction intervals

The results highlight some of the benefits of multilevel modeling and the limits of value-added ratings. By controlling for beer characteristics and separately estimating variance components for raters and beers nested in breweries, I have reduced the degree to which raters’ tastes and brewers’ preferences for certain types of beers are confounding brewery ratings. That is, the value-added ratings reflect the brewery’s overall quality with greater fidelity. Nevertheless, we should keep in mind that value-added ratings are based on error unexplained by theory/fixed effects, that they are point estimates within a range of certainty, and that one should interpret value-added ratings with caution because personal preferences still count. This analysis has motivated me to try beers by the breweries with high value-added ratings, but I know from experience that I like beers brewed by Brau Brothers, Lift Bridge, and Barley John’s, even though their value-added point estimates place them in the bottom half of Minnesota breweries.
