Each year the Department of Educational Psychology holds Graduate Student Research Day to showcase research conducted by its graduate students. About 90 people attended this year. I was one of six students who delivered a presentation. My fellow presenters–Ruth Swartwood, Cengiz Zopluoglu, Alicia Ayodele, Ben Seipel, and Breanne Byiers–all did an excellent job. Many other students shared their research via posters, all of which were outstanding. My presentation, “A spatial analysis of school district performance in Minnesota, demonstrating spatially enabled evaluation,” consolidated some of my earlier posts to this blog and summarized the paper that I am scheduled to present at the American Educational Research Association (AERA) meeting in San Diego. By looking to other social science disciplines that have become spatially enabled, I identified some ways that applied educational researchers can make better use of geographic mapping and spatial statistics. For example, we could enhance survey data and minimize respondent burden by spatially referencing the primary data and joining secondary data from the Census Bureau. Extending the promising uses, I spatially analyzed school district performance in Minnesota in 2007 and found the following.
- Neighboring school districts influenced performance to a small degree in limited instances (i.e., reading proficiency of third graders in poverty).
- Several school districts were found to have outperformed their neighbors, including Randolph, Medford, Orono, and Royalton.
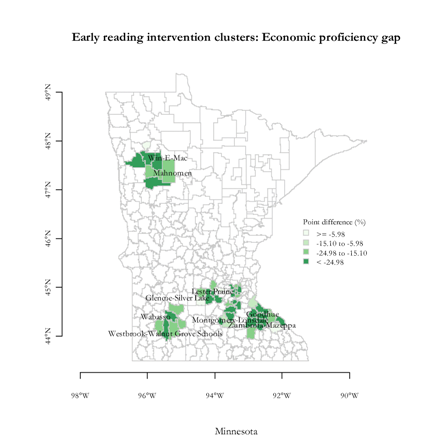
- Six clusters of adjacent, correlated school districts exhibited low reading proficiency, suggesting they should collaborate to improve preschool and early elementary reading efforts.
You can click on the image to access the full presentation: