I think I have settled on a dissertation topic: spatiotemporal piecewise regression evaluation. Spatiotemporal piecewise regression (SPR) refers to the analysis of longitudinal data from a spatial regression discontinuity (SRD) design with multiple pre-test observations. SRD offers a way to quasi-experimentally estimate local average treatment effects (LATEs) of geographically implemented programs or policies; SPR is a way to estimate change in LATEs over time. My dissertation will describe SPR methodology in detail, including validity threats, and demonstrate an SPR evaluation of an educational program. As discussed by Shadish, Cook, and Campbell, multiple pre-test observations will allow me to address validity questions.
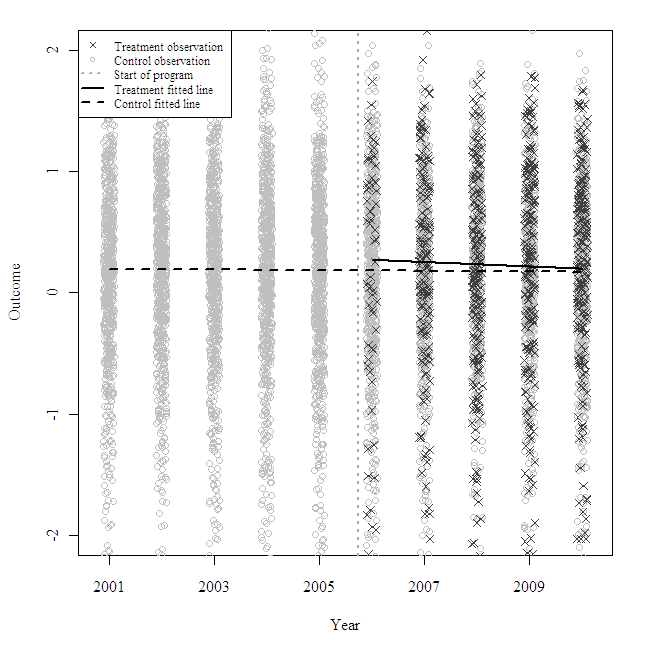
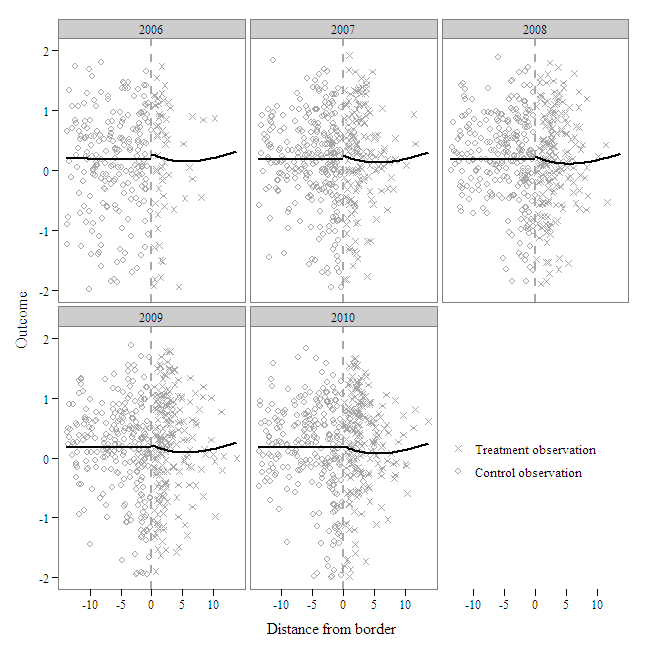
I decided to conduct a preliminary SPR analysis of data from the educational program to determine if the topic would be feasible and to include some results in a conference paper proposal. As discussed in earlier posts (here, here, and here), ![]() can be used to plot regression discontinuity fitted lines, showing the LATE at the treatment assignment cutoff point. The ggplot2 package can be used to plot SPR fitted lines and change in LATEs over time, but it’s not easy. One reason is that ggplot2 has a steep learning curve and limits control over the legend’s appearance, although its curve is not as steep as lattice’s. Another reason SPR plots are difficult to produce is that they represent several dimensions: north/south/east/west (reduced to one-dimensional distance), time, and the outcome. The SPR plots below show that participation in the educational program is associated with an initially positive, small LATE that diminishes over time.
can be used to plot regression discontinuity fitted lines, showing the LATE at the treatment assignment cutoff point. The ggplot2 package can be used to plot SPR fitted lines and change in LATEs over time, but it’s not easy. One reason is that ggplot2 has a steep learning curve and limits control over the legend’s appearance, although its curve is not as steep as lattice’s. Another reason SPR plots are difficult to produce is that they represent several dimensions: north/south/east/west (reduced to one-dimensional distance), time, and the outcome. The SPR plots below show that participation in the educational program is associated with an initially positive, small LATE that diminishes over time.
Spatiotemporal piecewise regression fitted line plots