Proficiency maps in Google Earth

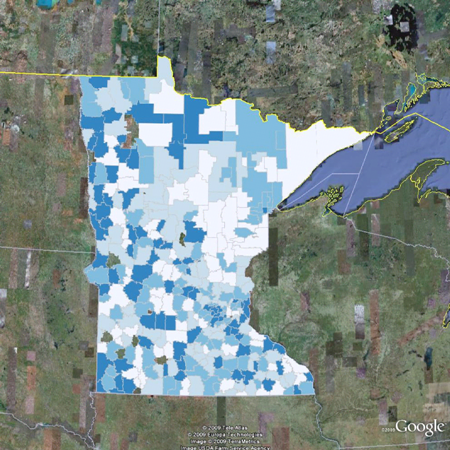
With spring semester in my rear view mirror, I found some time to use the Rlogo.jpg maptools package to make a proficiency map that can be displayed in Google Earth. It’s essentially a choropleth map in Keyhole Markup Language (KML) format. Google Earth takes visualizing educational outcomes to a whole new level. Distributing proficiency maps in KML format would make it easy for parents, school district employees, policy makers, and students themselves to explore their district’s test scores and those of nearby districts. Additionally, KML proficiency maps could help evaluators of educational programs involve stakeholders and frame questions.

Try it for yourself. You can click on the image below to explore Minnesota’s 3rd grade math proficiency results with Google Earth. After you’ve gotten your fill of zooming around the map, try the following:

  • Click on a district to activate a pop-up window containing the district’s name and results.
  • Click on the “+” sign next to “2007 Minnesota Comprehensive Assessments (MCA-II)” under the Places sidebar. The district results will expand downward, showing results in tabular format with map links. Double-click a district name in the sidebar to zoom to that location.
  • Use the Search -&gt Find Business section of the sidebar to find an after school tutoring program in a district of your choice.

Minnesota school districts: Math proficiency among third graders MCAII_2007_Math_3rd_Grade.png
Please leave a comment if you have any feedback about this approach.

Posted in Praxes | Comments Off on Proficiency maps in Google Earth

Spring break in Idaho

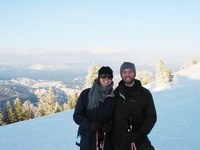
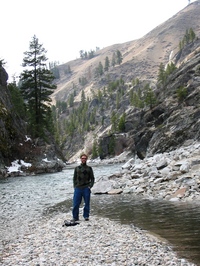
Amy and I visited her brother in Boise, Idaho, over spring break. It was great to see where Brad lives and to meet some of his friends and co-workers at Boise State University. It was also nice to be in the mountains–Minnesota is very flat! Boise reminded me of Boulder, Colorado, but with a more relaxed feel.

I spent some of my break finishing proposals for the American Evaluation Association conference and a survey instrument for the North Star STEM Alliance. Nevertheless, we experienced a lot in just a few days:

I highly recommend a visit to Idaho, if you’ve never been.

Bogus Basin and dining out
IMG_9675.jpg IMG_9800.jpg

Pine Flats hot springs
IMG_9771.jpg IMG_9731.jpg

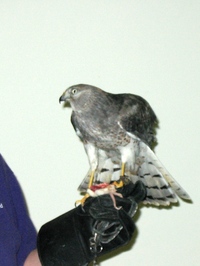
Harrier falcon and turkey vulture
IMG_9699.jpg IMG_9708.jpg

Posted in Personal | Comments Off on Spring break in Idaho

A spatial analysis of school district performance in Minnesota

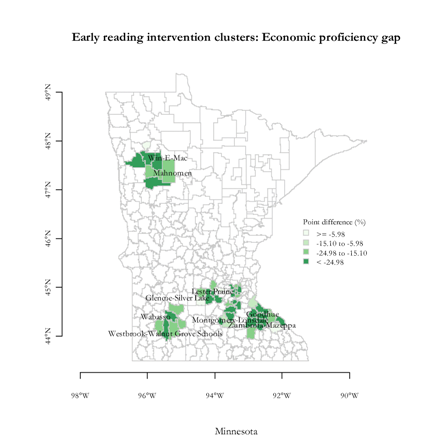
Each year the Department of Educational Psychology holds Graduate Student Research Day to showcase research conducted by its graduate students. About 90 people attended this year. I was one of six students who delivered a presentation. My fellow presenters–Ruth Swartwood, Cengiz Zopluoglu, Alicia Ayodele, Ben Seipel, and Breanne Byiers–all did an excellent job. Many other students shared their research via posters, all of which were outstanding. My presentation, “A spatial analysis of school district performance in Minnesota, demonstrating spatially enabled evaluation,” consolidated some of my earlier posts to this blog and summarized the paper that I am scheduled to present at the American Educational Research Association (AERA) meeting in San Diego. By looking to other social science disciplines that have become spatially enabled, I identified some ways that applied educational researchers can make better use of geographic mapping and spatial statistics. For example, we could enhance survey data and minimize respondent burden by spatially referencing the primary data and joining secondary data from the Census Bureau. Extending the promising uses, I spatially analyzed school district performance in Minnesota in 2007 and found the following.

  • Neighboring school districts influenced performance to a small degree in limited instances (i.e., reading proficiency of third graders in poverty).
  • Several school districts were found to have outperformed their neighbors, including Randolph, Medford, Orono, and Royalton.
  • Six clusters of adjacent, correlated school districts exhibited low reading proficiency, suggesting they should collaborate to improve preschool and early elementary reading efforts.


You can click on the image to access the full presentation: Reading_Gap_Clusters.png

Posted in Praxes | Comments Off on A spatial analysis of school district performance in Minnesota

Rokia Traoré concert at The Cedar Cultural Center

I saw Rokia Traoré perform at The Cedar Cultural Center last night. My familiarity with Ali Farka Touré and other Malian artists had me expecting a good show. My friend, Shane, heard a good preview on Minnesota Public Radio (at minute 2:17) and was psyched, too. Rokia and her band exceeded our expectations. They packed the house and had everyone dancing. Rokia’s singing was forceful at times and sultry at others, such as when she sang Gershwin’s “The Man I Love” to honor Billie Holiday. I looked around the audience and saw many jaws drop when she showed off her vocal prowess, not to mention her dance moves. The band was tight and having a lot of fun. As a Kentucky boy, I especially liked the banjo-like riffs from the Malian guitar. Their one encore song lasted about twenty minutes, segued in and out of Fela Kuti’s “Lady,” and featured a solo by each member of the band. Shane, Amy, and I went to Palmer’s afterwards, where we sat around the bonfire and swapped concert reviews with other folks who had been there. Don’t miss her when she comes to your town! Below are some video clips from last night’s concert. In the first clip, watch Rokia get rid of her mic stand so she can dance freely. She plays guitar in the second clip.

Posted in Personal | Comments Off on Rokia Traoré concert at The Cedar Cultural Center

Some favorite R commands

If Rlogo.jpg was a band, and if that band had a greatest hits album, and if the album featured R commands instead of songs, then the following commands should be counted among the greatest hits (or the most obscure hits).

  • windows(record=T) #place this near the top of your script to record all charts; enables scrolling through and compare charts with page up and page down
  • oldpar <- par(no.readonly=T) #assign default graphical parameters to an object, to be called back later with par(oldpar)
  • windowsFonts(Garamond = windowsFont(“TT Garamond”)) #add a new font family to the standard database
  • file.choose() #allows you to choose a file interactively instead of specifying the path and file name in quotes
  • describe() #a better alternative to summary(); from library(psych)
  • qq.plot() #plots a quantile-comparison chart with confidence bands; in library(car)
  • prplot() #a function in library(faraway) that produces partial residual plots
  • Make.Z() #normalizes all variables in a data frame, available in library(QuantPsyc)
  • ci.rc() #calculates a regression coefficient confidence interval, in library(MBESS)
  • hccm() #another from library(car); calculates heteroscedasticity-corrected covariance matrices for unweighted linear models
  • lmer() #a function in library(lme4) that fits linear mixed models
  • identify() #use this function in library(graphics) to label points in a scatter plot
Posted in Praxes | Comments Off on Some favorite R commands