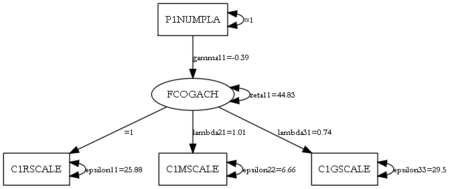
I am using data from the Early Childhood Longitudinal Study (ECLS) Birth Cohort for my research assistantship with Judy Temple. I have an analysis in mind that will involve factor analysis and path analysis simultaneously (i.e., a structural equation model).
The ECLS-B data and other large microdata sets represent the population, offer good statistical power, and provide comprehensive measures, making them suitable for structural equation modeling. However, those advantages are often achieved through stratified cluster sampling, which nests participants within primary sampling units in order to ensure adequate representation of strata and hold down data collection costs. Moreover, individuals representing small groups in the population are oversampled, which requires analytically re-weighting those cases downward to reflect population proportions but not down-weighting sample sizes in the standard error calculations. Calculating standard errors under complex sampling conditions is not straightforward compared to simple random sampling.
Is it possible to fit structural equation models of complex sample data in  ? Several statistical software programs, including the survey package, can perform standard analyses (e.g., means, generalized linear models) in a manner appropriate for complex sample data. However, hardly any programs offer the ability to fit structural equation models to such data. Using some guidance offered by John Fox, author of the sem package, and an excellent article by Laura Stapleton, I decided to give it a try with R.
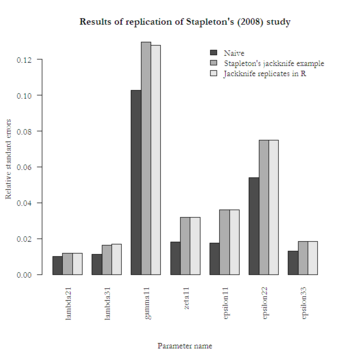
Stapleton used data from the ECLS Kindergarten Cohort and two commercial statistical software packages to demonstrate a structural equation model that applies sampling weights and accounts for multistage sampling. Because the ECLS-K is publicly available and  is free, I was able to attempt her jackknife example. As hoped, the replication yielded parameter estimates that were comparable to Stapelton’s, as well as standard errors that were larger than the naive standard errors. However, my jackknife standard errors were consistently larger than Stapleton’s. I don’t yet know why they were so large, but it will be good practice for me to find out. It will also be good practice to replicate her example of bootstrapping standard errors. I welcome any feedback about this approach.


